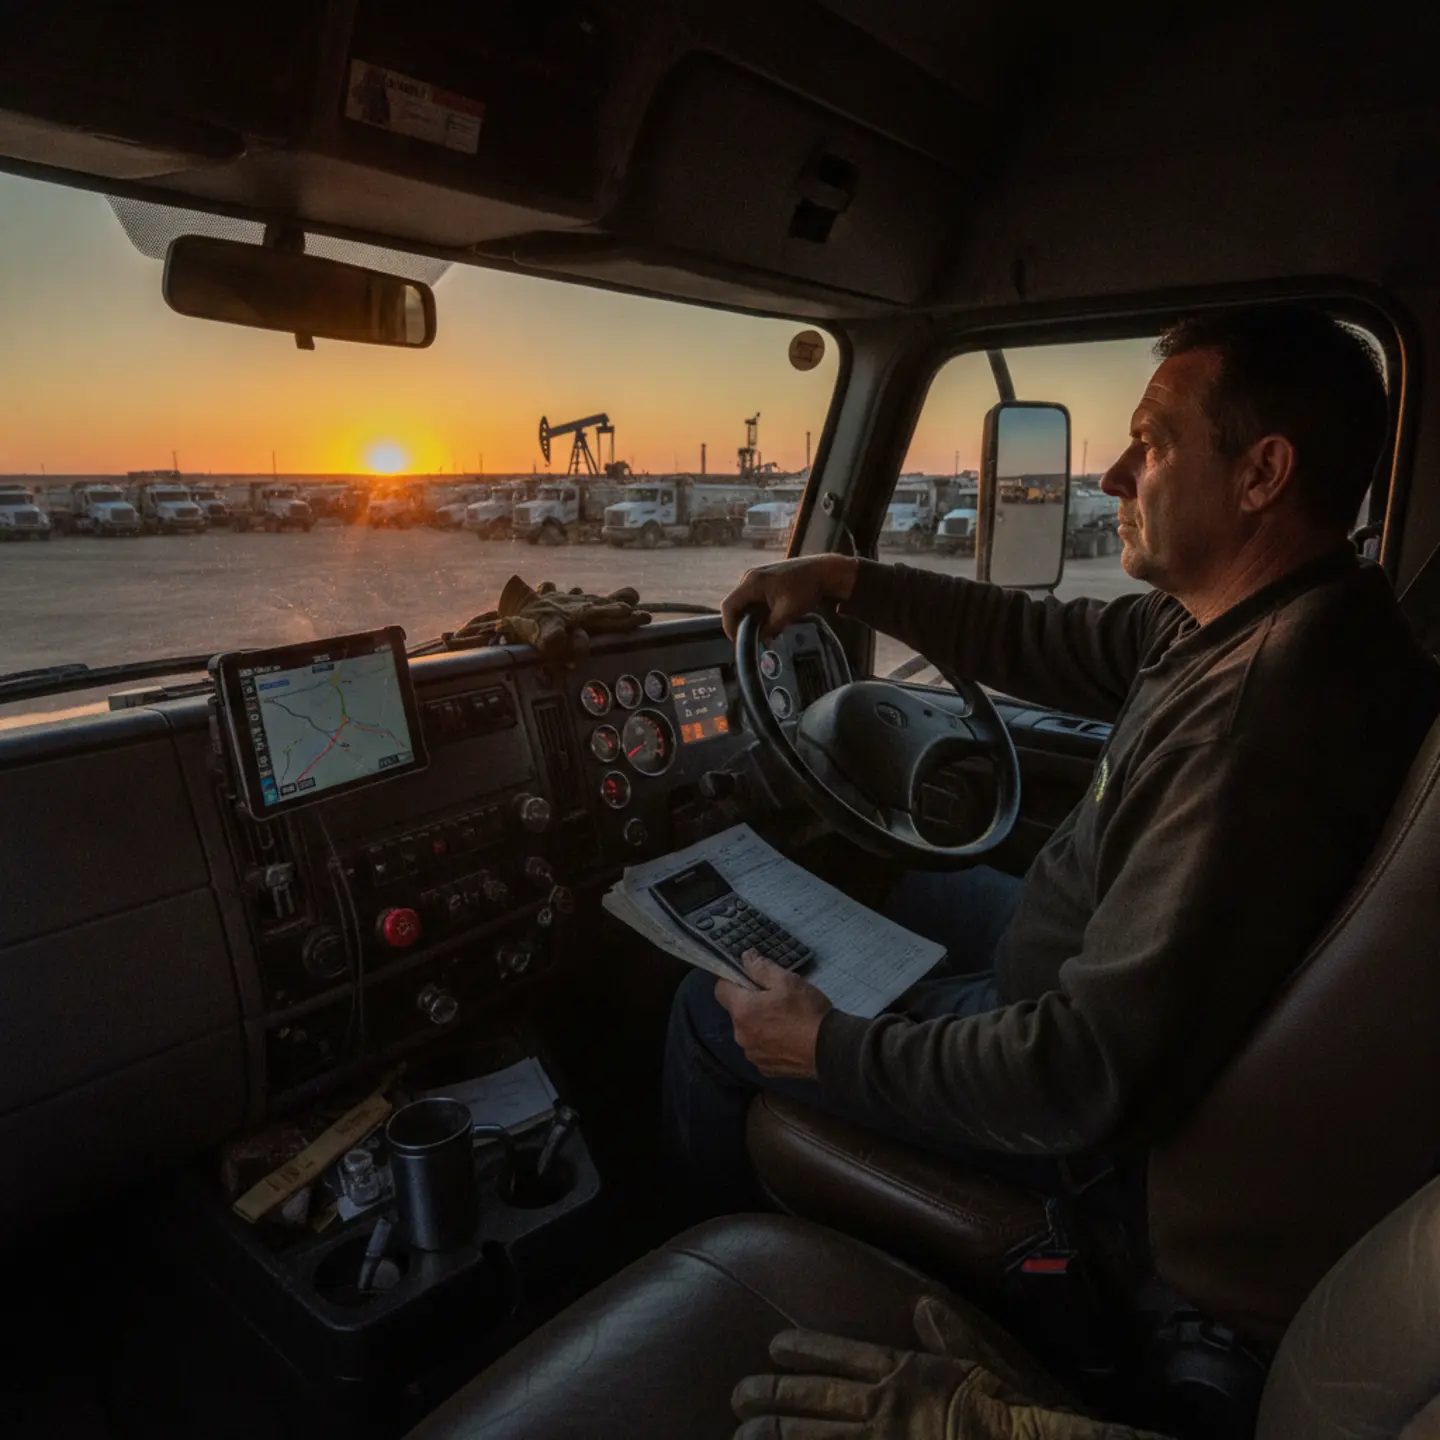
Owner Operator Frac Sand Hauling: The Real Numbers
The Permian Basin is projected to run 350–450+ active rigs in 2026 — the highest sustained activity level in the region’s recent history. That means consistent frac sand demand, loaded miles, and real earning potential for Owner-Operators who know how to position themselves. But here’s the thing nobody tells you upfront: the question was never whether loads exist. The real question is whether you’ll actually take home the money you think you will after fuel, insurance, carrier deductions, maintenance, and every other line item that quietly eats into your gross.
This guide is built for drivers who are done with vague promises and want the real numbers — gross revenue ranges, actual operating costs, net take-home realities, and the specific questions you need to ask before you sign anything. No hype. No hedging. Just the data you need to make a smart decision about your business and your future.
Key Takeaways
- → Permian Basin Owner-Operators can gross $2,500–$4,500+/week with pneumatic equipment — but net take-home is typically 30–50% of gross after all costs
- → Total weekly operating costs run $2,500–$5,150+ — fuel, insurance, truck payment, maintenance, and fees all add up fast
- → Frac sand hauling pays $2.50–$4.50+/loaded mile — significantly higher than dry van or flatbed, but operating costs are also significantly higher
- → Hidden carrier deductions — escrow holds, fuel card fees, trailer lease markups, unpaid deadhead — are the #1 reason Owner-Operators earn less than expected
- → Pneumatic tankers command higher rates but cost more to operate; hopper bottoms offer faster turns and simpler operations — neither is universally “better”
- → Vetting your carrier thoroughly — including FMCSA safety ratings, written deduction schedules, and detention/deadhead policies — is non-negotiable before you commit
- → The Permian Basin offers the strongest load consistency in the country right now — but competition is fierce, and operational efficiency is what separates high earners from struggling ones
The Permian Basin Frac Sand Market in 2026: Demand and Opportunity
Before you calculate earnings, you need to understand the market you’re stepping into. The Permian Basin isn’t just active — it’s operating at a level that drives sustained, consistent demand for frac sand hauling in a way that few other basins in the country can match. According to Baker Hughes rig count data and Texas Railroad Commission tracking, the Permian is projected to sustain 350–450+ active rigs through 2026. That’s not a spike — it’s a baseline. And every one of those rigs is consuming sand at a rate that keeps Owner-Operators loaded.
The Eagle Ford Shale, running 60–90+ rigs by current projections, offers solid opportunity as well — particularly for drivers based in South Texas — but it operates at a meaningfully lower volume than the Permian. If you’re choosing between basins, the Permian wins on raw load availability and rate potential. That said, the Eagle Ford remains a viable market, especially for drivers who prioritize proximity to San Antonio or the Laredo corridor over maximum gross revenue.
What’s driving this sustained demand? A combination of factors: continued E&P spending by major operators, the widespread adoption of zipper-frac completion techniques that run multiple frac stages simultaneously, and the presence of in-basin sand mines near West Texas that have reduced long-haul distances but dramatically intensified regional hauling demand. When sand doesn’t have to travel 800 miles from Wisconsin, it needs to travel 40 miles from a local mine to a well pad — and that’s your load.
Rig Count and Activity Trends
High rig counts translate directly to loaded miles. Each active rig requires a continuous supply of frac sand throughout its completion phase — and completions in the Permian are running longer and more sand-intensive than ever. Baker Hughes and Texas Railroad Commission data consistently show the Permian outpacing every other U.S. basin in both volume and consistency of activity. For an Owner-Operator, that means fewer dead weeks, less volatility, and more predictable income planning.
The Permian’s advantage over the Eagle Ford isn’t just volume — it’s density. Wells are clustered in ways that create efficient routing opportunities, and the concentration of operators in the Midland-Odessa corridor means carriers can keep trucks moving without excessive deadhead miles between loads.
Sand Consumption Per Well
Here’s a number that directly affects your load count: Permian Basin wells currently require 5,000–10,000+ tons of frac sand per completion. Eagle Ford wells use 3,000–7,000+ tons. These figures have been climbing steadily as operators extend lateral lengths and optimize completion designs to maximize production per well — and that trend is expected to continue through 2026 and beyond, according to SPE technical data and Hart Energy analysis.
To put that in practical terms: a single Permian well completion could require 200–400+ individual truck loads depending on trailer capacity. With multiple wells completing simultaneously across a pad, the demand for haulers is continuous and intense. More sand per well means more loads for you — and more opportunities to run efficiently if you’re positioned with the right carrier and equipment.
If you’re evaluating whether frac sand hauling makes sense as a business, joining a carrier built around Owner-Operator success is the fastest path to understanding how this market works from the inside. The demand is real — the question is how you position yourself to capture it.
Gross Revenue Ranges: What You’ll Actually Haul In
Let’s get into the numbers — because gross revenue is where most conversations start, and where most misunderstandings begin. The figures below are based on 2026 market data from DAT Freight & Analytics, OOIDA earnings surveys, and Owner-Operator forums. They represent realistic ranges for consistent, efficient drivers — not best-case scenarios, and not averages padded by outliers.
In the Permian Basin, a pneumatic tanker Owner-Operator can expect to gross $2,500–$4,500+ per week, translating to $130,000–$230,000+ annually at full utilization. Hopper bottom operators typically run $2,200–$3,800+ per week, or $115,000–$200,000+ annually. Eagle Ford rates run approximately 5–15% lower than Permian averages across both equipment types.
Frac sand hauling rates — $2.50–$4.50+ per loaded mile for pneumatic operations — are meaningfully higher than general dry van ($2.00–$3.00/mile) or flatbed ($2.40–$3.50/mile) freight. That premium reflects the specialized equipment required, the demanding operating conditions of oilfield roads, and the time-critical nature of frac completions. When a frac crew is waiting on sand, every hour of delay costs operators thousands — which is why carriers who deliver reliably command better rates.
Pneumatic vs. Hopper Bottom Economics
The pneumatic vs. hopper bottom decision is one of the most common questions new Owner-Operators ask — and the honest answer is that neither is universally better. Pneumatic tankers command higher per-ton rates and are in high demand for modern completion designs that require precise sand delivery. But they come with higher fuel consumption (the blower adds significant diesel burn), higher insurance costs, more complex maintenance, and a steeper learning curve for drivers without oilfield experience.
Hopper bottoms offer a lower barrier to entry, faster load/unload cycles, and simpler operations. The rates are lower per ton, but the faster turns can partially offset that gap if you’re running high volume. For a driver new to oilfield hauling, a hopper bottom in the Permian or Eagle Ford is often the smarter starting point — you build the market knowledge and relationships before stepping up to pneumatic operations.
Regional Rate Variation Across West Texas and Eagle Ford
The Permian Basin — centered on Midland and Odessa — commands the highest rates in Texas due to sheer volume and completion intensity. West Texas broadly remains competitive, with strong demand across the Delaware and Midland sub-basins. The Eagle Ford, running from Laredo up through San Antonio and east toward Cuero, offers solid opportunity but at a discount to Permian rates. Drivers in South Texas often find the Eagle Ford more accessible geographically, which can offset the rate differential through reduced deadhead and home time advantages.
One important caveat: gross revenue figures assume consistent loads. A carrier that promises $3,500/week but delivers inconsistent dispatch will cost you far more than a carrier offering $3,000/week with reliable, steady loads. Consistency compounds — it reduces deadhead, improves fuel efficiency, and lets you plan your business. Keep that in mind as we move into operating costs.
The Real Cost of Operating: Weekly Breakdown
Gross revenue is the headline. Operating costs are the reality check. This is where a lot of drivers get burned — not because they didn’t know costs existed, but because they underestimated how much they’d add up in oilfield conditions specifically. West Texas lease roads are not interstate highways. They will accelerate wear on every component of your truck and trailer in ways that general highway trucking simply doesn’t prepare you for.
Here’s a realistic weekly cost breakdown for a pneumatic Owner-Operator running in the Permian Basin, based on ATBS cost data and OOIDA studies:
| Cost Category | Weekly Range |
|---|---|
| Fuel (diesel + blower consumption) | $1,000 – $2,000+ |
| Insurance (liability, cargo, physical damage, occ. accident) | $300 – $600+ |
| Truck/trailer payment or lease | $700 – $1,500+ |
| Maintenance and tires reserve | $400 – $800+ |
| ELD, blower maintenance reserve, misc. fees | $100 – $250+ |
| TOTAL ESTIMATED WEEKLY COSTS | $2,500 – $5,150+ |
That $2,500–$5,150 weekly cost range doesn’t include your personal draw or living expenses. It’s purely what it costs to keep the truck running and legally compliant. When you stack that against a gross of $2,500–$4,500/week, you can see immediately why the margin between a profitable operation and a money-losing one is thinner than most people expect — and why carrier deductions and load consistency matter so much.
Fuel Costs and Efficiency in Oilfield Operations
Fuel is your largest variable cost, and in pneumatic operations, it’s even more significant because the blower system consumes additional diesel during unloading. A pneumatic tanker running its blower for 45–90 minutes per load can burn an extra 3–6 gallons per delivery — which adds up fast across a week of multiple loads. Diesel price fluctuations compound this: a $0.50/gallon swing can shift your weekly fuel cost by $150–$300+ depending on your mileage.
When evaluating carriers, pay close attention to their fuel surcharge program. The best carriers use a transparent index (like the DOE weekly retail diesel price) and pass through a meaningful percentage of the surcharge directly to drivers. Vague fuel programs that benefit the carrier at your expense are one of the most common hidden cost traps in this industry.
Insurance and Compliance Costs
Federal minimums for for-hire carriers are $750,000 liability and $100,000 cargo — but most legitimate frac sand carriers require significantly more: $1,000,000+ liability and $250,000+ cargo, plus physical damage coverage on your equipment and occupational accident coverage for yourself. That comprehensive package runs $300–$600+ per week depending on your equipment value, driving record, and the insurer.
Shop multiple insurers — rates vary significantly for the same coverage profile. And if you’re leasing onto a carrier that offers an insurance program, verify exactly what’s covered and what you’re paying for it. Some carrier insurance programs are genuinely cost-effective; others are priced as a profit center at your expense.
Equipment Maintenance in Oilfield Conditions
This is the cost that surprises new oilfield haulers the most. ATBS cost data shows that oilfield Owner-Operators should budget $10,000–$15,000+ annually for maintenance and tires — significantly higher than general highway trucking. West Texas caliche roads, lease road ruts, and the constant stop-and-go of oilfield operations accelerate wear on tires, suspension components, brakes, and drivetrain in ways that highway miles simply don’t.
For pneumatic operators, add $5,000–$15,000+ annually for blower maintenance — seals, vanes, bearings, and hose connections all require regular attention. A blower failure mid-delivery doesn’t just cost you the repair; it costs you the load, the detention time, and potentially your relationship with the carrier if it happens repeatedly. Budget for maintenance like your business depends on it — because it does.
Understanding your real operating costs is the foundation of a profitable frac sand hauling business. If you want to see how these numbers stack up against what a transparent, Owner-Operator-first carrier actually offers, explore Sisu’s hauling services and what they mean for your bottom line.
Net Take-Home Pay: What You Actually Keep
After operating costs and carrier deductions, a consistent, efficient Owner-Operator in the Permian Basin can realistically net $1,000–$2,500+ per week. That’s $52,000–$130,000+ annually — meaningful money, but a far cry from the gross revenue numbers that dominate recruiting conversations. The gap between gross and net is where your business lives or dies, and it’s almost entirely determined by two factors: your operating efficiency and your carrier’s deduction structure.
According to ATBS financial data, Owner-Operators in bulk/tanker operations typically net 30–50% of gross revenue after all costs. Company drivers may net a higher percentage of their earnings, but their gross is significantly lower ($70,000–$100,000 annually vs. $130,000–$230,000+ for Owner-Operators) — which means the Owner-Operator path still offers higher absolute net income potential if managed well. The keyword is “managed.”
The most important thing you can do to protect your net is understand exactly what your carrier deducts before you sign. Sisu’s Owner-Operator-first model is built around eliminating unnecessary deductions — no escrow requirements, minimal fees, and transparent fuel programs — because the company’s position is straightforward: your success is our success. That’s not marketing language; it’s the business model.
Understanding Carrier Deductions
Every carrier deducts something. The question is whether those deductions are reasonable, transparent, and disclosed upfront — or whether they’re buried in the lease agreement and discovered on your first settlement statement. Here’s what to look for:
- → Fuel surcharge pass-through: What index does the carrier use? What percentage of the surcharge actually reaches you? A carrier that collects a 20% fuel surcharge from the shipper but only passes 10% to you is keeping the difference as profit.
- → Escrow holds: Some carriers hold $1,000–$5,000 in escrow with vague or punitive release terms. This is cash you’ve earned but can’t access. Always ask: How much? When is it released? What triggers a hold or forfeiture?
- → Trailer lease markups: If the carrier provides the trailer, confirm what you’re paying vs. the actual market rate. A $350/week trailer lease that should be $200/week is a $150/week hidden deduction.
- → Insurance deductions: If you carry your own policy, confirm you’re not also being charged for the carrier’s program. Double-billing on insurance is more common than it should be.
Predatory Carrier Practices to Avoid
FMCSA complaint data and OOIDA surveys consistently identify the same patterns in predatory carrier operations. Forced dispatch on unprofitable loads — where the carrier assigns you a run that doesn’t cover your costs and you have no ability to decline — is one of the most damaging. If you’re running a $1,800 gross load that costs you $2,100 to complete, you’re paying to work. That’s not a business; that’s indentured servitude with a CDL.
Other red flags: vague or evasive answers about deductions, pressure to sign a lease agreement without adequate review time, mandatory high escrow without clear release terms, and lack of transparency about the carrier’s FMCSA safety record. Any carrier that responds to direct questions about pay and deductions with “it depends” or “we’ll work it out” is telling you something important about how they operate.
You’re Right to Question the Numbers
Most carriers don’t volunteer the real breakdown of gross vs. net, deductions, and hidden fees. Asking hard questions about take-home pay isn’t being difficult — it’s being smart about your business. Any carrier that makes you feel like you’re asking too much by requesting written documentation of all deductions is a carrier you should walk away from.
⚠ The Escrow Hold Trap
Some carriers hold $1,000–$5,000 in escrow with vague release terms. This is cash you’ve earned but can’t access — and in some cases, carriers find reasons to keep it when you leave. Always ask: How much? When is it released? What triggers a hold? What happens to it if I terminate the lease? Get every answer in writing before you sign.
Lease-On vs. Own-Your-Truck: The 12-Month Economics
One of the most consequential decisions you’ll make as a new frac sand hauler isn’t which basin to work or which equipment to run — it’s whether to lease onto a carrier fleet or own your own truck. Both paths can be profitable. Both carry real risks. And the right choice depends heavily on your financial situation, risk tolerance, and how much business management you’re prepared to take on.
Leasing onto a carrier means lower upfront capital requirements. The carrier often provides or arranges the trailer, offers fuel card programs, handles compliance support, and provides dispatch infrastructure. The trade-off is that you’re paying for all of that through deductions and markups — and the net earnings are typically lower than what a well-managed independent operation can achieve. Leasing builds experience with lower financial risk; ownership builds equity with higher potential reward.
Lease-On Advantages and Real Trade-Offs
The primary advantage of leasing onto a carrier is the lower barrier to entry. You don’t need $150,000–$200,000 in capital or financing to get started. The carrier’s infrastructure — fuel programs, insurance options, compliance support, and dispatch — reduces the operational complexity you have to manage on your own. For a driver new to oilfield hauling, that support structure has real value.
The trade-offs are real, though. Carrier deductions, trailer lease costs, and markups on programs that benefit the carrier reduce your net earnings. You may have less control over dispatch — which loads you take and when. And if the carrier’s business struggles, your load consistency suffers directly. The key is finding a carrier whose deduction structure is transparent and genuinely driver-friendly, not one that uses the lease-on model as a mechanism to extract value from drivers.
Ownership Advantages and Challenges
Owning your truck and trailer outright — or financing them independently — gives you full control over your operation. You choose your carrier, negotiate your rates, manage your own costs, and build equity in your equipment over time. According to ATBS financial modeling, Owner-Operators who own their equipment and manage it efficiently can achieve net margins of 45–60% of gross revenue — significantly higher than the 30–40% typical of lease-on arrangements.
The challenges are significant: you need substantial upfront capital or strong financing, all costs and liabilities fall directly on you, and you need genuine business management skills to track costs, negotiate rates, and plan for downtime. Ownership is not for everyone — but for drivers with the financial foundation and business discipline, it’s the path to the highest net earnings in this industry.
Pneumatic vs. Hopper Bottom Equipment Costs Over Time
Over a 12-month period, a pneumatic operation typically carries higher total costs — initial equipment cost or lease, blower maintenance ($5,000–$15,000/year), higher insurance premiums, and greater fuel consumption — but also commands higher gross revenue if utilization is strong. A hopper bottom operation has lower costs across the board but requires higher volume to achieve equivalent net earnings. Neither is inherently superior; the math depends on your specific rates, miles, and operational efficiency.
Pneumatic vs. Hopper Bottom: The Real Trade-Off
Pneumatic tankers command higher per-ton rates but cost more to operate and maintain. Hopper bottoms have lower rates but faster turns and simpler operations. The “better” choice depends on your efficiency and market positioning — not just the rate sheet. A hopper bottom driver running 6 loads/week at $2,400 gross may net more than a pneumatic driver running 4 loads/week at $3,200 gross once you account for blower fuel, maintenance, and insurance differentials.
Regulatory Requirements and Compliance Costs for Frac Sand Haulers
Operating legally as an Owner-Operator in frac sand hauling requires navigating a specific set of federal and state requirements. None of it is impossibly complex, but the timeline and costs are real — and underestimating either can delay your start date or create compliance problems that affect your ability to work.
The baseline requirements: a USDOT number for all commercial vehicle operations, MC Authority for interstate for-hire hauling (which most frac sand operations require), a BOC-3 process agent filing, and proof of minimum insurance filed with FMCSA. The total cost to establish authority runs $300–$1,000+, and the timeline from application to active authority is typically 2–6 weeks. Plan accordingly — you can’t start hauling until your authority is active.
FMCSA Registration and Authority
Register your USDOT number through the FMCSA Unified Registration System online — it’s straightforward and free. MC Authority for interstate for-hire operations requires a separate application and a $300 filing fee. Most frac sand hauling crosses state lines at some point, so interstate authority is typically required. If you’re operating exclusively within Texas, you may need TxDMV intrastate authority instead — confirm with your carrier and a transportation attorney if you’re unsure.
The BOC-3 filing designates a process agent in each state where you operate — it’s a legal requirement and typically costs $30–$75 through a process agent service. Don’t skip it; operating without a BOC-3 on file can result in your authority being revoked.
Insurance and Bonding Requirements
Federal minimums are $750,000 liability and $100,000 cargo. In practice, every legitimate frac sand carrier requires more — typically $1,000,000+ liability, $250,000+ cargo, plus physical damage on your equipment and occupational accident coverage for yourself as a non-subscriber to workers’ compensation. That comprehensive package runs $300–$600+ per week depending on your profile.
Shop multiple insurers before committing. Rates for the same coverage can vary by 20–40% between providers. Progressive, Great West Casualty, Canal Insurance, and several specialty oilfield trucking insurers all compete for this business. An independent insurance broker who specializes in commercial trucking can save you significant money compared to going direct.
Texas Weight Limits and Permitting for Frac Sand Loads
Standard GVW on Texas state highways is 80,000 lbs. Frac sand loads frequently exceed this — which is why overweight permits are standard practice in this industry. TxDOT issues overweight permits for state highways allowing up to 90,000–100,000+ lbs GVW depending on axle configuration and route. County permits are required for FM roads and lease road access, and requirements vary by county.
Compliance is not optional — overweight violations carry heavy fines and can affect your CSA score. Your carrier should be providing route-specific permit guidance, or you should be working with a permit service that handles this for you. Never assume a permit covers a county road just because it covers the state highway portion of your route.
Vetting Carrier Safety and Compliance
Before you sign with any carrier, take five minutes to verify a carrier’s safety rating using FMCSA’s SAFER System. Enter the carrier’s USDOT number and review three things: their Safety Rating (Satisfactory is what you want), their Out-of-Service rates (aim below 20% for both vehicle and driver), and their crash history. A carrier with a “Conditional” or “Unsatisfactory” rating, high out-of-service rates, or a significant crash record is a carrier whose problems will eventually become your problems.
Low CSA scores across the key BASICs — Hours of Service, Vehicle Maintenance, Driver Fitness — are positive indicators. High scores in those categories suggest a carrier that either doesn’t maintain equipment properly or pushes drivers to violate HOS rules. Either scenario puts you at risk.
What FMCSA Safety Ratings Actually Mean
A “Satisfactory” FMCSA rating means the carrier has passed a compliance review and meets federal safety standards. “Conditional” means deficiencies were found that require correction. “Unsatisfactory” means the carrier has serious safety violations — do not lease to them. Out-of-Service rates above 20% are a red flag regardless of the overall rating. The SAFER System is free and takes 5 minutes — use it every time.
Navigating FMCSA registration, insurance requirements, and carrier compliance vetting can feel like a full-time job before you’ve even turned a wheel. Working with a carrier that provides compliance support and handles the complexity for you can make the difference between a smooth start and a costly delay. See the most common questions Owner-Operators ask about getting started.
Seasonal Demand Patterns and Load Consistency in Frac Sand Hauling
Frac sand hauling is less seasonal than many other freight categories — oilfield operators don’t stop drilling because it’s December — but it’s not immune to cyclical patterns either. Understanding when demand peaks and when it softens helps you plan cash flow, build maintenance reserves during slower periods, and position yourself for maximum earnings during high-activity stretches.
The Permian Basin generally offers the most consistent year-round demand of any Texas basin, which is one of its core advantages over the Eagle Ford. When E&P operators are running high rig counts and deploying capital aggressively, the Permian keeps drivers busy across all four quarters. That said, even the Permian has patterns worth knowing.
Quarterly Activity Trends
Q1 often sees the softest activity of the year. E&P operators are finalizing new budgets, and the post-holiday period can slow completions activity as crews return and ramp back up. This isn’t a dead period — loads still run — but it’s the quarter where load consistency is most variable. Drivers who have built strong relationships with their carrier and demonstrated reliability tend to get first access to available loads during Q1 slowdowns.
Q2 typically sees moderate activity as operators execute against their annual completion plans. Weather can be a factor — spring rains in parts of Texas can limit lease road access temporarily, and the transition into summer heat begins to affect operational efficiency.
Q3 and Q4 are generally the strongest quarters for frac sand hauling. Operators are deploying remaining capital budgets, completion crews are running at full capacity, and the pressure to hit year-end production targets drives sustained demand. If you’re going to run hard and build your maintenance reserve, Q3/Q4 is when you do it.
Weather and Environmental Factors in West Texas
West Texas summer heat — regularly exceeding 110°F in the Permian — creates real operational challenges. Equipment runs hotter, tires wear faster, and driver fatigue is a genuine safety concern. Winter freeze-offs, while less frequent in West Texas than in North Texas, can shut down operations for days when they occur. Heavy rain events can make caliche lease roads impassable, cutting off well pad access entirely until conditions improve. Build weather contingencies into your cash flow planning — a week of weather-related downtime with fixed costs still running is a real financial hit.
Evaluating Frac Sand Carriers: Questions to Ask Before You Commit
Choosing the right carrier is the single most impactful decision you’ll make as a frac sand Owner-Operator. The difference between a transparent, driver-focused carrier and a predatory one isn’t just a few hundred dollars per week — it can be the difference between a profitable business and one that bleeds you dry while you work 70-hour weeks. Use this framework every time you evaluate a carrier, and don’t sign anything until you have written answers to every question on this list.
Research shows that drivers typically evaluate 3–5 carriers before committing. The drivers who end up in the best situations are the ones who ask the hardest questions upfront — not the ones who take the first offer that sounds good. You can review Sisu’s blog for additional resources on evaluating carriers and maximizing Owner-Operator earnings.
Pay Structure and Transparency
Start with the most direct question possible: “What is my average weekly gross and net take-home expectation for a driver with my equipment and experience running your lanes?” Demand a specific number, not a range. If the recruiter can’t give you a specific answer, they either don’t know their own business or they’re deliberately vague to avoid accountability.
Follow up with: “Walk me through every deduction that will appear on my weekly settlement — fuel program costs, insurance, trailer lease, fees, escrow, anything else.” Get the complete list in writing. Then ask for a sample settlement statement from a current driver with similar equipment and lanes. If the carrier won’t provide one, that’s your answer.
Verify the fuel surcharge calculation specifically. Ask: “What index do you use for fuel surcharge? What percentage of the surcharge passes through to me?” The DOE weekly retail diesel index is standard and transparent. A carrier using a proprietary index that you can’t independently verify is a red flag.
Load Consistency and Dispatch Policies
Ask: “What is the average weekly miles and load count for Owner-Operators running my equipment type in my region?” Consistency is your real profit lever. A carrier that guarantees 5 loads/week at $2,800/load is worth more than one promising $3,200/load with inconsistent work — the math is simple: 5 × $2,800 = $14,000 vs. 3 × $3,200 = $9,600 in a slow week.
Understand the dispatch model: Are loads assigned or can you select them? Is dispatch forced or voluntary? What are the detention and deadhead pay policies — specifically, at what point does detention pay kick in, what’s the rate, and how is deadhead compensated? Unpaid deadhead miles are one of the most significant hidden costs in frac sand hauling, and carriers that don’t address this clearly in writing are telling you they don’t pay it.
Ask for references from current Owner-Operators running the same equipment and lanes. Call them. Ask specifically about load consistency, settlement accuracy, and how the carrier handles disputes. A carrier confident in their operation will welcome this; one that discourages it has something to hide.
Red Flags That Should End the Conversation
Some answers — or non-answers — should end the evaluation immediately. Walk away from any carrier that:
- ✗ Gives vague or evasive answers about pay, deductions, or escrow terms
- ✗ Pressures you to sign the lease agreement before you’ve had adequate time to review it
- ✗ Requires mandatory high escrow holds without clear, written release terms
- ✗ Uses forced dispatch on loads that don’t cover your operating costs
- ✗ Can’t or won’t show you their FMCSA safety rating or explain their out-of-service history
Load Consistency Is Your Real Profit Lever
A carrier that delivers 5 consistent loads/week at $2,800/load is worth more than one promising $3,200/load with unreliable dispatch. Consistency compounds — it reduces deadhead miles, improves fuel efficiency, lets you plan maintenance around your schedule, and builds the kind of operational rhythm that separates high-earning Owner-Operators from ones who are always chasing the next load.
Ready to find a carrier that respects your business?
Sisu’s Owner-Operator-first model is built on the exact principles outlined in this guide — transparent pay, no hidden deductions, no escrow, and 24/7 live human dispatch. Read our full breakdown of whether frac sand hauling is worth it in 2026 — then decide if Sisu is the right fit for your operation.
Owner-Operator Market Trends and Future Outlook Through 2026
The frac sand hauling market isn’t static — it’s evolving in ways that create both opportunity and risk for Owner-Operators entering or expanding in this space. Understanding the direction of the market helps you make better decisions about equipment, carrier selection, and long-term business strategy.
The most significant structural trend is the persistent driver shortage. ATA Driver Shortage Reports and ATBS Owner-Operator studies consistently show that qualified, reliable drivers with oilfield experience and clean safety records are in short supply relative to demand. That shortage benefits you directly — carriers are competing for good drivers, which means you have more negotiating leverage than you might think when it comes to rates, deductions, and dispatch policies. Use it.
Driver Shortage and Negotiating Leverage
Oilfield experience and pneumatic certification are genuine differentiators in this market. A driver with 3+ years of pneumatic frac sand hauling, a clean MVR and PSP, and a strong safety record can command better rates and more favorable lease terms than a driver without that background. If you’re coming from highway trucking into oilfield work, investing in pneumatic blower certification and getting your PEC SafeLand card before you approach carriers puts you in a stronger negotiating position from day one.
The driver shortage also means that carriers with poor reputations are struggling to retain quality drivers — which creates churn and instability in their operations. Carriers that treat drivers well and pay transparently tend to retain experienced operators, which improves their load consistency and safety record. The market is self-correcting in this way: good carriers attract good drivers; predatory carriers cycle through drivers and eventually face capacity problems.
Consolidation and Market Structure
Carrier consolidation is an ongoing trend in frac sand hauling. Larger carriers are gaining market share as smaller operators exit due to cost pressures and operational complexity. This consolidation can offer Owner-Operators more stability and support — larger carriers typically have more robust compliance infrastructure, fuel programs, and dispatch resources. The trade-off is less flexibility and, in some cases, less personal attention from dispatch.
Against this backdrop, specialized niche carriers focused on all-pneumatic operations are emerging as a compelling alternative — combining the efficiency and rate advantages of pneumatic specialization with a more driver-focused culture than large, diversified carriers. Sisu’s all-pneumatic fleet and Owner-Operator-first model represents exactly this trend — purpose-built for the type of operation that maximizes driver earnings in the current market.
Long-Term Demand Outlook for Permian Frac Sand Hauling
EIA projections and industry analyst forecasts from sources including Rystad Energy consistently point to sustained E&P investment in the Permian Basin through 2026 and beyond. Completion efficiency programs — longer laterals, more sand per lateral foot, zipper-frac techniques — are driving sand demand per well higher, not lower. For Owner-Operators with the right equipment, the right carrier, and the business discipline to manage their costs, the long-term outlook in this market is genuinely strong. The opportunity is real. The work is available. The question — as always — is whether you’ll structure your operation to capture it efficiently.
Real Owner-Operator Stories: Earnings and Lessons Learned
Data ranges and averages only tell part of the story. The real picture comes from understanding how specific drivers — with specific equipment, in specific markets, with specific carriers — actually perform. The following anonymized case studies are based on composite data from ATBS financial records, Owner-Operator forums, and industry earnings analysis. They illustrate the range of outcomes and, more importantly, the factors that determine where you land in that range.
“The difference between a driver grossing $3,200/week and netting $1,400 vs. one grossing $2,800 and netting $1,600 isn’t the rate — it’s the deductions and the operational efficiency. The math is unforgiving.”
Case 1 — Experienced Pneumatic Driver, Permian Basin: Grossing $3,200/week, netting $1,400/week (44% net margin). This driver runs a pneumatic tanker leased onto a carrier with transparent deductions, consistent dispatch, and a fair fuel surcharge program. The 44% net margin reflects efficient routing, disciplined maintenance reserves, and a carrier that doesn’t nickel-and-dime. The driver’s success factors: 5+ years of oilfield experience, pneumatic certification, clean safety record, and a carrier relationship built on mutual accountability.
Case 2 — New Hopper Bottom Driver, Eagle Ford: Grossing $2,400/week, netting $900/week (37% net margin). This driver is in their first year of oilfield hauling, running a hopper bottom in the Eagle Ford. The lower net margin reflects higher fuel costs due to less efficient routing, a carrier with moderate deductions, and a maintenance reserve that’s being built from scratch. The path forward: build oilfield experience, optimize routing, and potentially transition to a carrier with better deduction structure once the track record is established.
Case 3 — Owner-Operator with Own Truck, West Texas: Grossing $2,800/week, netting $1,600/week (57% net margin). This driver owns their truck outright, sources loads through a combination of a dedicated carrier relationship and direct broker contacts, and manages their own costs with disciplined tracking. The 57% net margin is achievable because there are no carrier markups on programs — every cost is direct. The challenge: this driver spent 3 years building the relationships and business systems that make this possible. It’s not a Day 1 outcome.
What Separates High-Earning Owner-Operators from Struggling Ones
Across all three cases and the broader data, the same factors consistently separate drivers who build profitable businesses from those who struggle:
- → Carrier selection: Choosing a transparent, driver-focused carrier is the highest-leverage decision you’ll make. The difference in net earnings between a good carrier and a predatory one can exceed $500/week — $26,000+ annually.
- → Operational efficiency: Route planning, fuel management, and maintenance discipline compound over time. Drivers who track their cost-per-mile and optimize routes consistently outperform those who don’t.
- → Business mindset: Tracking costs weekly, building maintenance reserves, planning for seasonal slowdowns, and negotiating from a position of knowledge — these are business management skills, not trucking skills. Both matter.
- → Safety and compliance: A clean safety record isn’t just about avoiding fines — it’s a business asset. Carriers give their best loads and most consistent dispatch to drivers they trust. A good safety record is the foundation of that trust.
Frequently Asked Questions About Frac Sand Hauling
After fuel, insurance, truck and trailer payments, maintenance reserves, and carrier fees, a net take-home of $1,000–$2,500+ per week is achievable for consistent, efficient Owner-Operators running in the Permian Basin. This figure varies significantly based on your gross rate, weekly miles, operational efficiency, and — critically — your specific carrier’s deduction structure. The key to landing